Wildfire is shaping the CA Insurance Market.
Stanford University Climate and Energy Policy Program has released a white paper that looks at the current home insurance crisis with origins like Prop 103 that goes back as far 1988.
Proposition 103, although enacted to manage a surge in the auto insurance premiums, established a statutory framework for rate setting, regulatory interpretations and enforcement practices.
A few highlights from the report:
Between 2020 – 2026:
- Homeowner premiums are up 84%
- Deductibles rose from $1,813 – $2,553 representing financial pressures on homeowners
- A growing number of homeowners are being forced onto FAIR Plan
- FAIR Plan now covers ~5% of California homes, up from ~2% in 2020
- ~60% of homeowners in California have at least one mortgage
- More than 1 in 17 new home loans are being written with minimal coverage that protects little more than fire, smoke, and lightning
- We are now paying more for less coverage
- FAIR Plan is not for high-risk areas anymore. It is rapidly expanding into low and moderate risk areas
- Home insurance has started to affect overall home affordability
Wildfire Risk Reduction has become the driver of affordability. Improving long-term affordability in high-risk areas will require substantial reductions in physical risk to create affordable premiums.
Do you know what these terms mean?
- FAIR Plan
- Admitted Insurers
- Excess and Surplus (E&S) Insurers
- Residual Insurers
- HO-6, HO-3, DO, and DT Policies
Understanding home insurance used to be something our insurance brokers needed to know. The cost and importance of home insurance now demands that we have a good understanding of the different types and coverage of these plans. Your understanding could make a big difference in affordability and coverage in the event of a wildfire.
FAIR Plan has a rate increase of 29.1% scheduled for October 2026
Click on the button below to learn more and view home insurance rate increases by ZIP code:
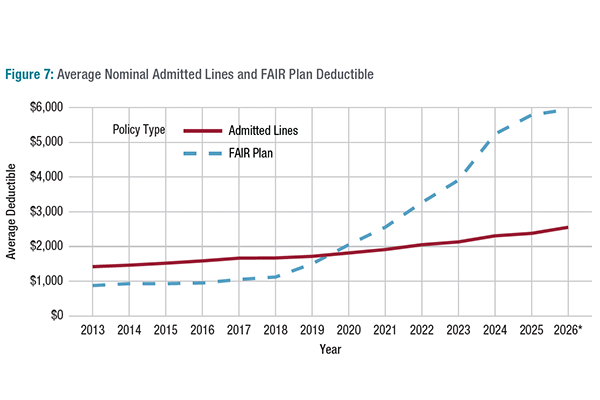
Image Courtesy: Stanford Climate & Energy Policy Program
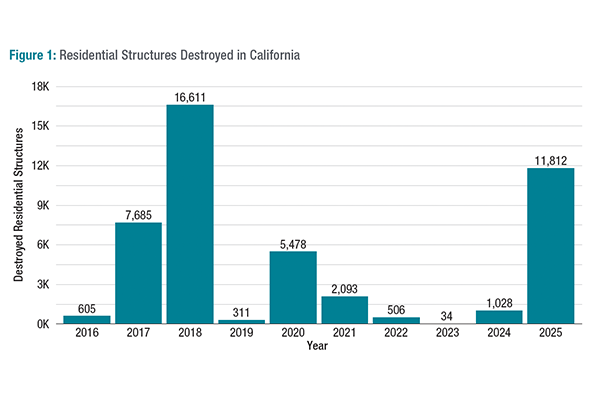
Image Courtesy: Stanford Climate & Energy Policy Program